Poverty Level 2025: Federal Income Guidelines, Chart by Family Size, and Benefits Guide
The poverty level 2025 refers to the federal poverty guidelines published by the U.S. Department of Health and Human Services on January 15, 2025. For the 48 contiguous states and Washington, D.C., the 2025 federal poverty level is $15,650 for a single individual and $32,150 for a family of four.
These figures reflect a 2.9% CPI-U inflation adjustment over 2024 and are used to determine eligibility for dozens of federal low-income assistance programs.
Key Takeaways
- The 2025 federal poverty level for a family of four is $32,150 in the 48 contiguous states and Washington, D.C., up from $31,200 in 2024.
- Each additional household member adds $5,500 to the poverty guideline, producing a standardized income limit by household size across all qualifying programs.
- In states that expanded Medicaid under the Affordable Care Act, households earning up to 138% of the 2025 FPL, $21,597 for a single person, qualify for coverage.
- The 2025 FPL governs 2026 ACA Marketplace subsidies; anyone checking their premium tax credit eligibility for 2026 coverage uses the 2025 figures, not the 2026 guidelines.
What Is the Federal Poverty Level for 2025?
The 2025 federal poverty level is the income benchmark the U.S. government uses to measure economic need and determine eligibility for federal assistance programs. The U.S. Department of Health and Human Services sets and publishes these figures annually through its Office of the Assistant Secretary for Planning and Evaluation (ASPE).
HHS calculates the guidelines by applying the annual percentage change in the Consumer Price Index for All Urban Consumers (CPI-U), published by the Bureau of Labor Statistics, to the prior year’s figures. The 2025 guidelines reflect a 2.9% price increase between 2023 and 2024.
They were published in the Federal Register on January 17, 2025, and took effect that same month.
Three separate guideline schedules exist: one for the 48 contiguous states and D.C., one for Alaska, and one for Hawaii, the latter two carrying higher thresholds to reflect greater costs of living in those states.
The federal poverty guidelines are the operative figures for program eligibility. The chart below shows every household size from one to eight persons across all three geographic schedules.

2025 Federal Poverty Level Chart by Household Size
The table below shows the exact annual income limits at 100% FPL for households of 1 through 8 persons across all three geographic schedules. Figures are confirmed as of January 2025 via the Federal Register.
| Household Size | 48 States and D.C. | Alaska | Hawaii |
|---|---|---|---|
| 1 | $15,650 | $19,550 | $17,990 |
| 2 | $21,150 | $26,430 | $24,320 |
| 3 | $26,650 | $33,310 | $30,650 |
| 4 | $32,150 | $40,190 | $36,980 |
| 5 | $37,650 | $47,070 | $43,310 |
| 6 | $43,150 | $53,950 | $49,640 |
| 7 | $48,650 | $60,830 | $55,970 |
| 8 | $54,150 | $67,710 | $62,300 |
| Each additional person | +$5,500 | +$6,880 | +$6,330 |
Source: U.S. Department of Health and Human Services, January 2025.
The $5,500 per-person increment for the 48 contiguous states is a standardized figure HHS sets to keep program eligibility calculations consistent across agencies. Alaska and Hawaii use higher per-person increments,$6,880 and $6,330, respectively, for the same reason.
Most programs apply a percentage multiple of these base figures rather than the 100% figure itself. Most programs apply a percentage multiple of these base figures, and the multiple that applies depends entirely on the program being checked.
FPL Percentage Thresholds and What the Key Benchmarks Mean for You
Most federal programs do not use 100% of the FPL as their income cutoff. Each program applies a specific percentage multiple, and the threshold that applies to your situation depends entirely on which program you are checking.
The table below shows the eight most commonly referenced FPL percentage benchmarks, the programs that use each one, and the corresponding annual income limit for a single individual and a family of four.
| FPL Percentage | Program | 1 Person | Family of 4 |
|---|---|---|---|
| 100% | Base FPL | $15,650 | $32,150 |
| 130% | SNAP gross income limit | $20,345 | $41,795 |
| 138% | Medicaid expansion threshold | $21,597 | $44,367 |
| 150% | SNAP net income limit (some states) | $23,475 | $48,225 |
| 185% | WIC; free school meals (NSLP) | $28,953 | $59,478 |
| 200% | CHIP (most states) | $31,300 | $64,300 |
| 250% | ACA cost-sharing reductions | $39,125 | $80,375 |
| 400% | ACA premium tax credit cap (2026) | $62,600 | $128,600 |
Note: Figures calculated from the base 2025 FPL and rounded to the nearest dollar. Source: HHS, Federal Register, January 2025.
The 400% FPL cap for premium tax credits returned for 2026 coverage.
The enhanced subsidy rules introduced by the American Rescue Plan Act and extended through 2025 by the Inflation Reduction Act expired on January 1, 2026, meaning households above 400% of the federal poverty level are generally not eligible for Marketplace premium tax credits for 2026 coverage under current law.
Which Federal Programs Use the 2025 Poverty Level?
According to the U.S. Department of Health and Human Services, the poverty guidelines are used to determine financial eligibility for a wide range of federally funded programs. More than a dozen programs across health coverage, food assistance, and energy aid use the FPL as their primary income eligibility benchmark.
Health coverage programs that use the 2025 FPL:
- Medicaid: Covers adults in households earning up to 138% FPL in the 40 states and D.C. that expanded Medicaid under the ACA; income counting uses modified adjusted gross income (MAGI)
- Children’s Health Insurance Program (CHIP): Covers children in families earning between 200% and 300% FPL, depending on the state
- ACA Marketplace premium tax credits: Available to households between 100% and 400% FPL for 2026 coverage plans
- ACA cost-sharing reductions: Available on Silver-tier Marketplace plans for households between 100% and 250% FPL
Food, energy, and other assistance programs that use the 2025 FPL:
- Supplemental Nutrition Assistance Program (SNAP): Gross income limit of 130% FPL; net income limit of 100% FPL for most households
- Special Supplemental Nutrition Program for Women, Infants, and Children (WIC): Income limit of 185% FPL
- National School Lunch Program (NSLP): Free meals at 130% FPL; reduced-price meals at 185% FPL
- Low Income Home Energy Assistance Program (LIHEAP): Typically 150% FPL or 60% of state median income, whichever is higher
- Head Start: Income limit of 100% FPL, with limited exceptions for children in foster care or receiving public assistance
The benefit year each program uses to calculate eligibility is not always the current calendar year.
Which FPL year a program is currently using depends on its benefit-year calendar, a detail that directly affects whether an application is timely or premature.

The Year Lag Rule and Which FPL Year Applies to Your Benefits Right Now
Two different FPL years are operating simultaneously in 2026, depending on which program applies to your situation. This is the most commonly misunderstood aspect of the federal poverty guidelines, and getting it wrong leads directly to incorrect eligibility assessments.
Here is how the three-rule breakdown works for 2026:
- ACA Marketplace subsidies for 2026 coverage: The 2025 FPL applies. The Affordable Care Act requires that Marketplace subsidy eligibility be calculated using the prior calendar year’s poverty guidelines. If you enrolled in a 2026 Marketplace plan, your premium tax credit and cost-sharing reduction eligibility was calculated against the 2025 figures in this article.
- Medicaid and CHIP eligibility from early 2026 onward: The 2026 FPL now applies in most states. States transition to the newly published guidelines between February and April each year. If you applied for Medicaid after approximately March 2026, your state almost certainly used the 2026 poverty guidelines.
- SNAP, WIC, NSLP, and most non-Marketplace programs: The 2025 FPL continues to apply through September 30, 2026, before these programs transition to the 2026 guidelines at the start of the new federal fiscal year.
HHS publishes updated guidelines each January, but program transition dates follow each agency’s own fiscal calendar rather than the publication date.
The ACA’s prior-year rule for Marketplace subsidies is statutory, written into the law itself. Other programs simply update on whatever schedule their administering agency sets.
The 2025 federal poverty guidelines govern 2026 ACA Marketplace premium tax credit eligibility by statute. This prior-year rule means a household shopping for 2026 Marketplace coverage compares its projected 2026 income against the 2025 FPL figures, not the 2026 guidelines.
Assuming the most recently published FPL applies to every program simultaneously is the single most common eligibility calculation error.
For Medicaid applicants, checking directly with the state agency confirms which FPL year is currently in use.

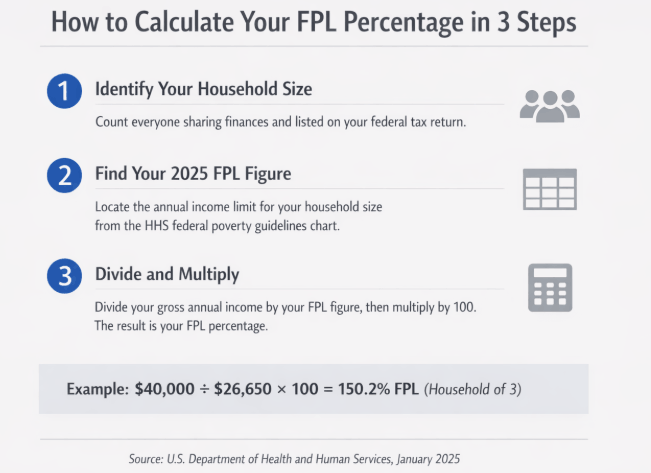
How to Calculate Your FPL Percentage in 3 Steps
Knowing your FPL percentage before applying to any program tells you precisely which thresholds you are above or below, saving time and preventing incorrect applications. Three steps produce an exact FPL percentage for any household.
- Identify your household size. Count every person who lives with you and shares financial resources, including yourself, your spouse, dependent children, and any other dependents claimed on your federal tax return.
- Find your matching 2025 FPL figure. Use the chart above to locate the annual income limit for your household size in the 48 contiguous states (or Alaska or Hawaii if applicable). For a household of three in the 48 contiguous states, that figure is $26,650.
- Divide your gross annual income by that figure and multiply by 100. The result is your FPL percentage. A household of three earning $40,000 per year sits at 150.2% FPL ($40,000 ÷ $26,650 × 100). That household clears the 138% Medicaid expansion threshold but falls below the 185% WIC limit, qualifying for WIC but not Medicaid in an expansion state.
For SNAP and ACA Marketplace purposes, note that programs compare your annual income compared to the poverty line using gross income before most deductions, though each program applies its own income-counting rules.
SNAP uses a net income test as well. Medicaid uses modified adjusted gross income rather than gross income.
Poverty Guidelines vs Poverty Thresholds: What Is the Difference?
Poverty guidelines and poverty thresholds are related but serve entirely different purposes, and the distinction matters for anyone checking eligibility or interpreting poverty statistics.
The poverty guidelines are issued by HHS through ASPE each January. They are simplified, administratively standardized figures used by federal and state programs to determine eligibility for low-income assistance.
Every household-size increment is uniform, $5,500 in the 48 contiguous states, because programs need a consistent formula to apply across millions of applicants.
The poverty thresholds are issued by the U.S. Census Bureau. They are statistically complex figures that vary by family composition, age of the householder, and number of children.
The Census Bureau uses them to produce the official national poverty rate, the annual measurement of how many Americans live below the poverty line.
Mollie Orshansky, a statistician working at the Social Security Administration, developed the original poverty measure in 1963 using minimum food budget data, a methodology that underpins both the guidelines and the thresholds to this day.
HHS itself notes that the term “federal poverty level” is technically ambiguous and recommends using “poverty guidelines” in administrative and legislative contexts.
For any eligibility determination, Medicaid, SNAP, ACA subsidies, or any other federal program, the poverty guidelines are the operative figure. The Census Bureau’s thresholds are never used directly to assess whether an individual qualifies for a benefit.
Conclusion
The 2025 federal poverty guidelines set clear income thresholds that determine access to Medicaid, SNAP, ACA Marketplace subsidies, CHIP, LIHEAP, and more than a dozen other programs.
The core figures, $15,650 for a single person and $32,150 for a family of four, were published by HHS in January 2025 and remain the operative benchmarks for most federal programs through late 2026.
Calculate your FPL percentage, identify the threshold that applies to your program, and verify current figures at aspe.hhs.gov before applying.
FAQ
What income is considered poverty level in 2025?
The 2025 poverty level is $15,650 per year for a single individual in the 48 contiguous states and Washington, D.C. For a family of four, the figure is $32,150. These are the 100% FPL figures. Most assistance programs use a percentage multiple of these amounts rather than the base figure itself.
What is 138% of the federal poverty level for 2025?
The 138% FPL threshold for 2025 is $21,597 for a single individual and $44,367 for a family of four in the 48 contiguous states. This is the Medicaid expansion income limit in the 40 states and D.C. that expanded coverage under the Affordable Care Act.
Does the federal poverty level differ by state?
No, with one important exception. The FPL is identical for all 48 contiguous states and Washington, D.C. Alaska and Hawaii have separate, higher guidelines to account for their greater costs of living. No other state-by-state variation exists in the base guidelines, though individual program eligibility rules vary significantly by state.
What is the poverty level for a family of 4 in 2025?
The 2025 poverty level for a family of four is $32,150 per year in the 48 contiguous states and D.C. Alaska and Hawaii carry higher figures at $40,190 and $36,980, respectively. For program eligibility, most households checking against this figure will use a percentage multiple, 138% for Medicaid expansion, 200% for CHIP in most states.
What is 130% of the federal poverty level for 2025?
The 130% FPL for 2025 is $20,345 for a single individual and $41,795 for a family of four in the 48 contiguous states. This is the gross income limit for SNAP eligibility in most states. Households at or below this threshold may qualify for food assistance, subject to additional program rules.
Disclaimer: The information provided in this article is for educational purposes only; please consult with official state or federal agencies to verify current eligibility before applying for any assistance programs.